Monitoring and incidents
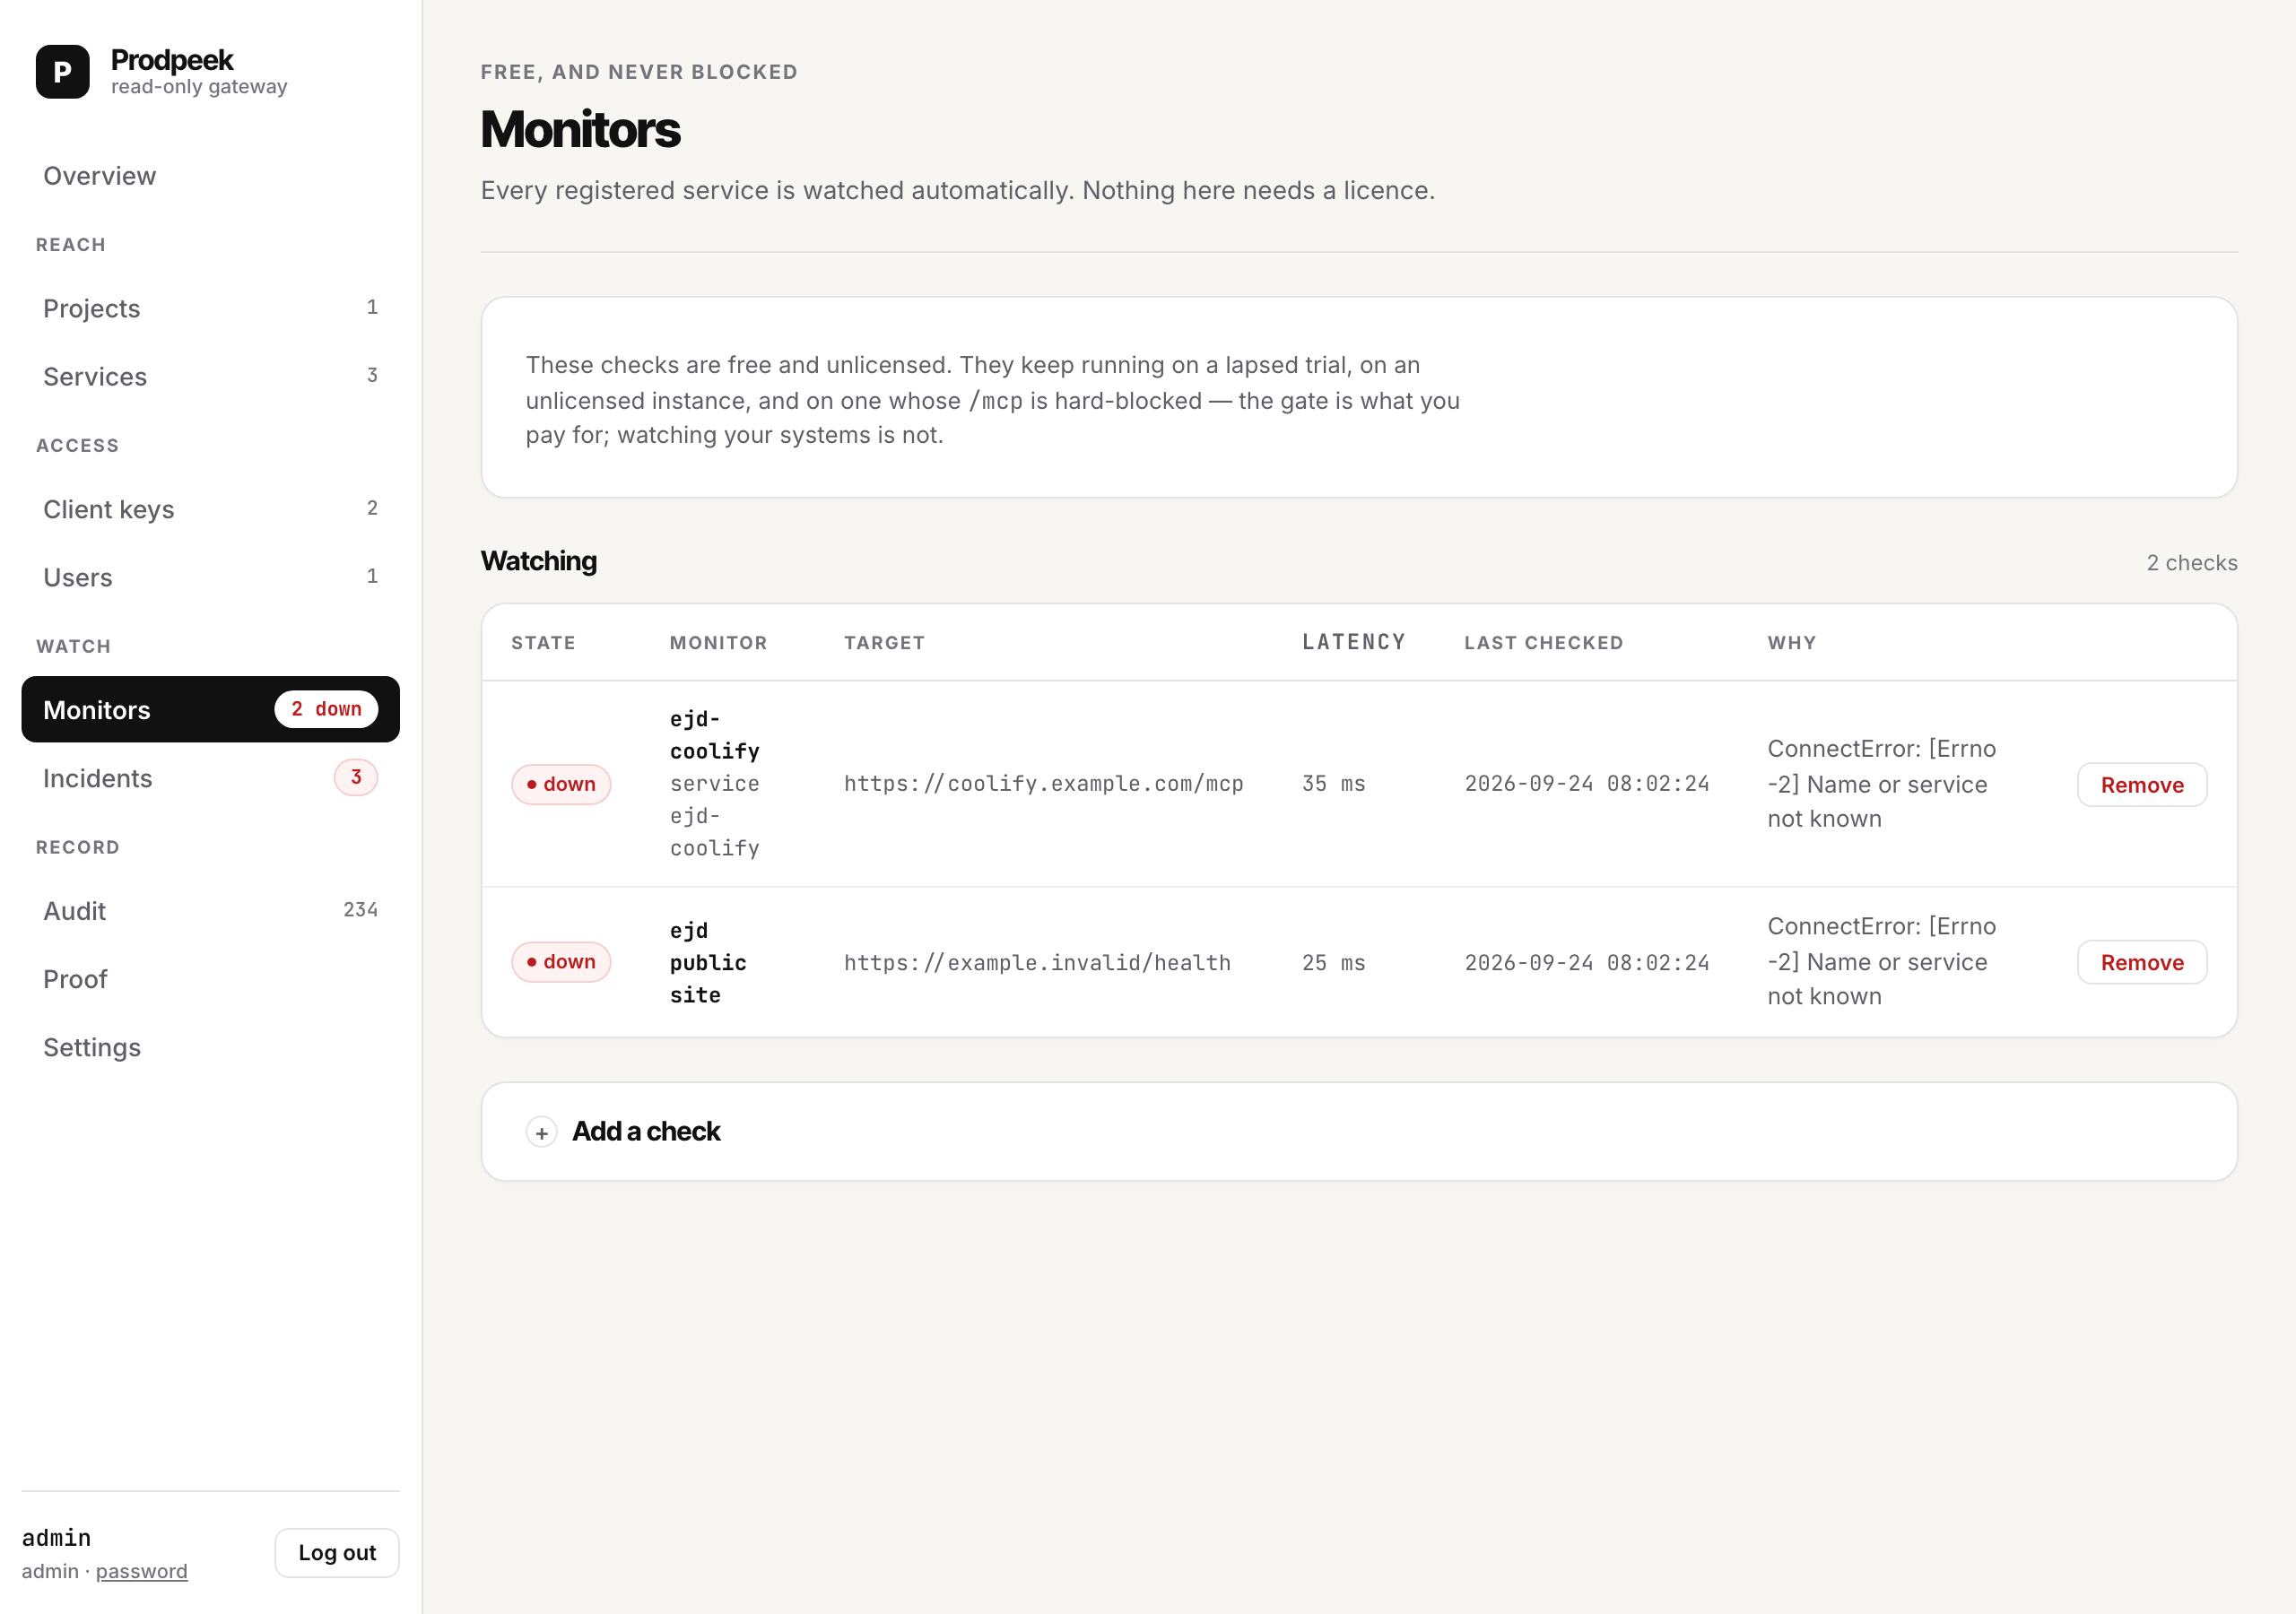
Free, unlicensed, and never blocked. Every service you register is watched automatically, and this keeps working on an expired trial — the gate is what you pay for; watching your systems is not.
What you get without doing anything
Register a service and it has a monitor. The check matches the kind: an HTTP
request for http, a TCP connect and banner read for ssh, a TCP connect for
postgres. Deliberately lighter than Test connection, which is the
authenticated deep check a human asks for — an authenticated probe every 60
seconds fills your auth log with our noise.
Free-standing checks
Monitors → Add a check for anything else — your public site, a health endpoint, a third-party dependency.
Any 2xx or 3xx after up to five redirects is up. Certificate expiry is recorded and warns from 14 days out — as an annotation, never a state change. An expiring certificate is not an outage, and paging someone as though it were teaches them to ignore pages.
The flapping guard
Three consecutive failures before DOWN. One is the internet, two is a bad minute, three is an outage. One notification on the transition, one on recovery with the duration — and an incident opens covering the contiguous DOWN period.
A paused monitor is never DOWN and never notifies. That is what planned maintenance is for.
The evidence pack
This is the part worth understanding, because it is what makes an incident useful at 02:00.
When a monitor goes DOWN, Prodpeek runs the reads that the project's profiles say to run first — an ordered list with fixture arguments, written by whoever wrote the profile — and attaches the results to the incident as a timeline.
spec:
  evidence:
    - tool: list_applications
      args: {}
      why: what this project is running, and whether Coolify agrees it is up
    - tool: get_logs
      args: {lines: 200}
      why: what the application said just before it stopped answering
Three properties make this safe to run unattended:
- It goes through
/mcplike anything else — an internal, short-lived, project-scoped key; every read judged by the same policy; every read in the audit log. The pack has no privileged path, so it cannot read anything an agent could not. - A profile can only name tools it allows. Enforced when the profile loads, not when the pack runs. An evidence step naming a denied tool is a profile that does not load.
- It works with no AI configured. The pack is deterministic facts in order. No interpretation, no ranking, no summary.
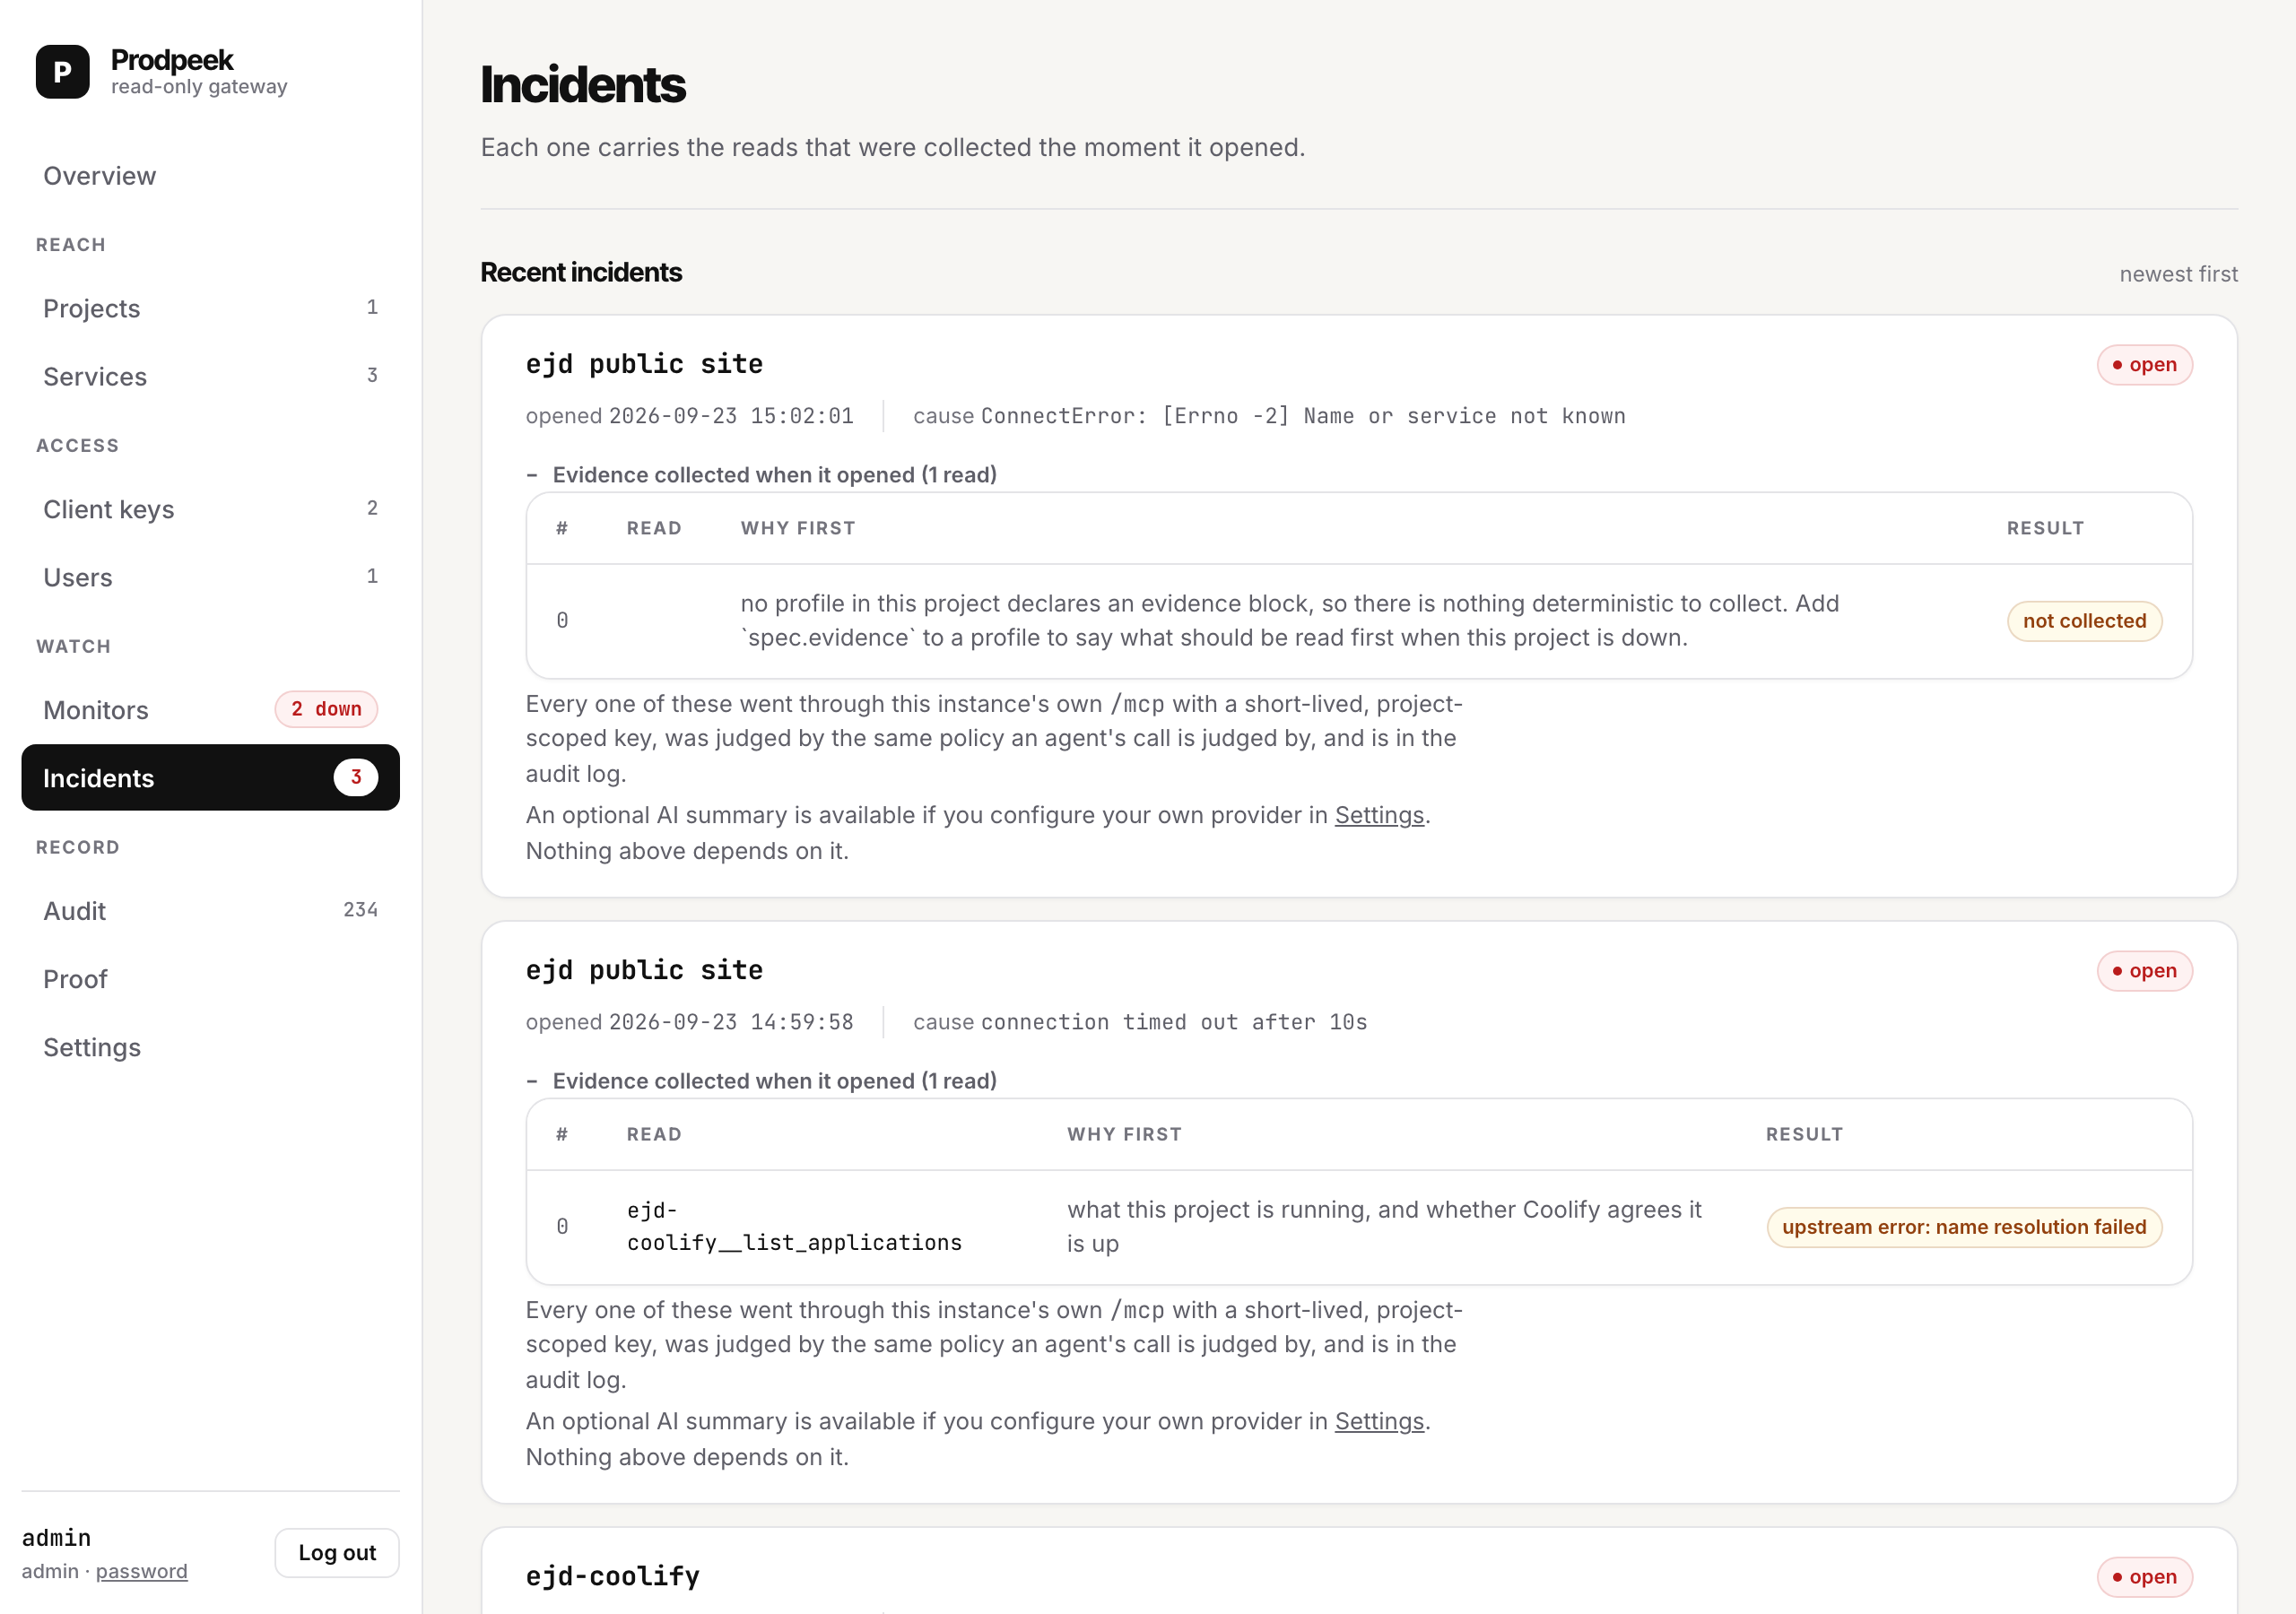
If no profile in the project declares an evidence block, the incident says so rather than arriving empty — an empty timeline reads as "nothing was wrong".
Notifications
Per project, a webhook URL. One POST per transition, carrying the monitor, the project, the state, the timestamp and the reason — and never a credential.
{
  "monitor": "EJD public site",
  "project": "ejd",
  "state": "down",
  "target": "https://ejd.dk/health",
  "timestamp": "2026-09-24T02:14:03+00:00",
  "reason": "ConnectTimeout: timed out after 10s",
  "incident_id": "a3f9c2e1",
  "evidence": [{"step": 0, "service": "ejd-coolify", "tool": "list_applications", "ok": true}]
}
Point it at Slack, Discord, or your own handler.
The optional AI layer
With your own provider key configured (Settings → AI), two extra things become available. Both are off unless you turn them on, and the incident above is complete without either.
Summarise — a button on an incident. One call, monitoring telemetry only, labelled with provider, model and time. Stored with the incident, so reopening it makes no second call.
The investigator — per project, off by default: "AI may read production data
from this project". With it on, a DOWN starts an agent loop whose single tool is
your own instance's /mcp, with an internal read-only key. At most 20 calls, 3
minutes, one run per incident. It produces a hypothesis, the evidence behind it,
and what a human should check first.
That loop is Prodpeek's own claim, tested on itself: if an agent behind this gateway cannot harm production, running one here is the cheapest proof. Every call it makes is in your audit log.
What travels, exhaustively
Without the opt-in: monitor telemetry only. With it: the results of allowed
reads from that project. Never, under any setting: a credential, the audit
log, or anything a tool classified read_leaks returned.
Where the licence sits
The trial gate is scoped to /mcp and only /mcp. Monitoring, incidents,
evidence packs, the console, the API and prove keep running on an unlicensed
instance. A monitor that went quiet because a payment lapsed would be worse than
no monitor, because you would not know it had.